Calculate Burned Area #
FLAM › Calculate Burned Area converts fire probability into expected burned area. It has two modes:
- Calibration (Optimize): fits the suppression efficiency q to observed burned area.
- Projection (Use existing data): applies a q you calibrated earlier.
Steps #
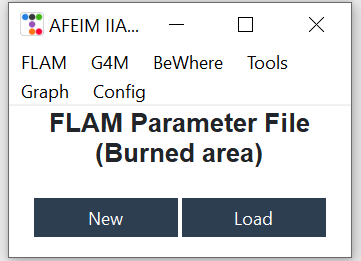
- Parameter file. Click New or Load (a separate
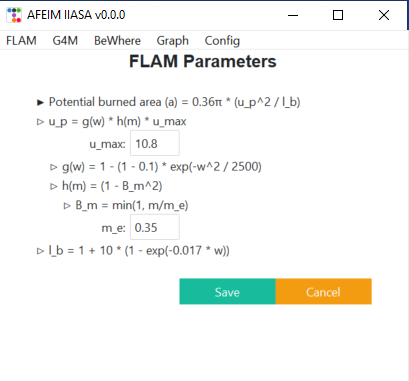
.inifrom the probability step). - FLAM Parameters. Adjust
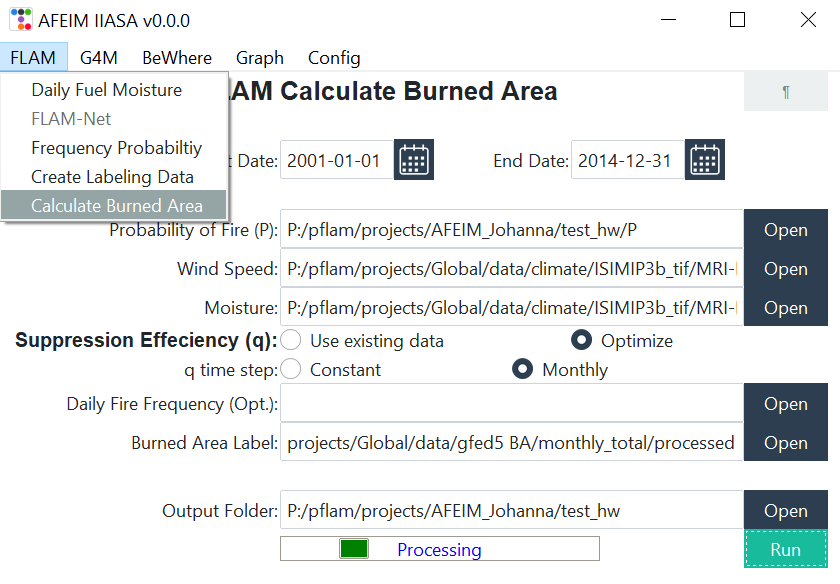
u_maxandm_e, then click Save. - FLAM Calculate Burned Area. Set the inputs and click Run.
Parameters #
a   = 0.36·π · u_p² / l_b                 potential area one fire burns in a day (km²)
u_p = g(w) · h(m) · u_max                 rate of spread (km/day)
g(w) = 1 − 0.9·exp(−w² / 2500)            wind effect, w in km/h
h(m) = (1 − min(1, m / m_e))²             moisture effect, m as a fraction
l_b = 1 + 10·(1 − exp(−0.017·w))          length-to-breadth ratio of the fire ellipse

A_burn = P · a · (1 − q)(2 − q) / q²      expected burned area per pixel and day (km²)
| Parameter | Default | Meaning |
|---|---|---|
u_max | 10.8 | Maximum rate of spread, km/day (0.45 km/h × 24 h) |
m_e | 0.35 | Moisture of extinction: above it, fire doesn’t spread |
The GUI window shows
h(m) = 1 − B_m². The code uses(1 − B_m)², as shown above.
Inputs #
| Field | Description | ¶ fills from |
|---|---|---|
| Start Date, End Date | Calibration or projection period | Config dates |
| Probability of Fire (P) | P folder from Frequency Probability | Results/P |
| Wind Speed | Daily folder | Daily Wsp |
| Moisture | Daily folder | Daily Mois |
| Suppression Efficiency (q) | Optimize or Use existing data | — |
| Output Folder | Results |
Optimize shows these extra fields:
| Field | Description | ¶ fills from |
|---|---|---|
| q time step | Monthly (default): one q per calendar month. Constant: one q for the whole year. | — |
| Daily Fire Frequency (Opt.) | Observed daily fire occurrence. If set, calibration uses it instead of P as the ignition input. | Results/Label_Fq_daily |
| Burned Area Label | Observed monthly burned area, km² per pixel, files named <name>_YYYYMM.tif | Results/Label_BA_monthly |
Use existing data shows one extra field:
| Field | Description |
|---|---|
| Existing q | Folder that contains only the calibrated q.tif, or only q_01.tif … q_12.tif |
How calibration works #
- AFEIM first predicts burned area with q = 0.5.
- It groups the prediction around each pixel with observed fires.
- It solves q so that predicted and observed totals match in each group.
- It fills the rest of the map from the nearest group.
With Monthly, each calendar month is calibrated on all years in the period. A month with no observed fires takes q from the nearest month that has fires.
Output #
| Folder | Files | Content |
|---|---|---|
a | a_YYYYMMDD.tif | Potential burned area per fire-day (km²) |
q | q.tif or q_MM.tif | Calibrated suppression efficiency (0–1) |
q_ct.tif / q_MM_ct.tif | q at observed fire locations, before filling the rest of the map | |
A_burn | A_burn_YYYYMMDD.tif | Daily burned area (km² per pixel). NoData −9999. |
- The
afolder is reused. Ifa/already covers the whole period, the tool doesn’t recalculate it. After you changeu_max,m_e, wind or moisture, deletea/or use a new Output Folder.- To reuse q, copy only
q.tiforq_01.tif…q_12.tifinto a separate folder, without the*_ct.tiffiles, and select that folder as Existing q.
Check the result with Graph: plot A_burn against your burned area labels.