Create Labeling Data #
FLAM › Create Labeling Data turns fire perimeter polygons into rasters of observed burned area on your model grid. Calculate Burned Area uses these rasters for calibration.
You don’t need this step if your observations are already gridded (for example GFED). In that case, see Input data.
Inputs #
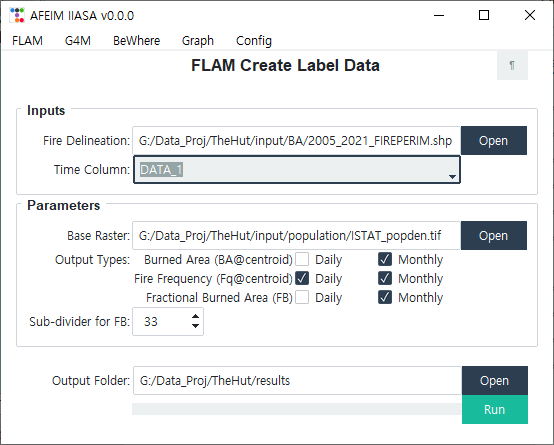
| Field | Description | ¶ fills from |
|---|---|---|
| Fire Delineation | Polygon shapefile, one polygon per fire, in a projected CRS in metres | Fire Shape |
| Time Column | Attribute with the fire date as YYYY-MM-DD. The tool preselects the first column whose name contains “date” or “time”. | — |
| Base Raster | Defines the output grid | Base Map |
| Output Folder | Where the subfolders are created | Results |
Output types #
Tick Daily and/or Monthly for each type:
| Type | Pixel value | Default | Output |
|---|---|---|---|
| Burned Area (BA@centroid) | Area of the fire (km²), placed in the pixel that contains the fire’s centroid | Monthly | Label_BA_monthly/BA_YYYYMM.tif |
| Fire Frequency (Fq@centroid) | 1 where a fire’s centroid falls in the pixel | Daily, Monthly | Label_Fq_daily/Fq_YYYYMMDD.tif |
| Fractional Burned Area (FB) | Share of the pixel covered by fire polygons (0–1) | Monthly | Label_FB_monthly/FB_YYYYMM.tif |
Daily outputs go to the matching *_daily folders, named with YYYYMMDD. Pixels without fire are NoData (0).
Sub-divider for FB (default 33) splits each pixel into an n × n grid to measure the burned share. With 33, there are 1089 sub-cells, so the precision is about 0.1 %. Higher values are more precise but slower.
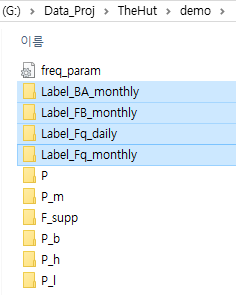
Burned Area (monthly) and Fire Frequency (daily) are the outputs that Calculate Burned Area needs.
If several fires in the same period have their centroids in the same pixel, values aren’t added up: the pixel keeps the value of only one fire. At coarse resolution, compare the totals with your source data.